Graph paper with graphs combines a familiar coordinate grid with plotted examples, making it easier to understand how mathematical data is represented visually. Instead of starting with a completely blank grid, learners can study completed graphs, identify patterns, compare data, and use the examples as a guide for creating their own graphs.
This type of graph paper can be useful for students, teachers, homeschool lessons, math practice, science projects, and anyone who needs a simple visual reference for plotting data. A well-designed printable can include several graph types, such as linear, quadratic, sine, exponential, bar, and multiple-line graphs.
What Is Graph Paper With Graphs?
Graph paper with graphs is a printable worksheet that combines a coordinate grid or graph-paper background with one or more completed graphs. The grid provides a visual framework for plotting points, while the example graph demonstrates how data can be represented on that framework.
Traditional graph paper is usually blank, allowing users to create their own graphs. Graph paper with examples goes a step further by providing visual models that can be studied, traced, analyzed, or used as references.
Depending on the purpose of the worksheet, a page may contain a single large graph or several smaller graphs. Different sections can demonstrate different mathematical relationships or data presentation methods.
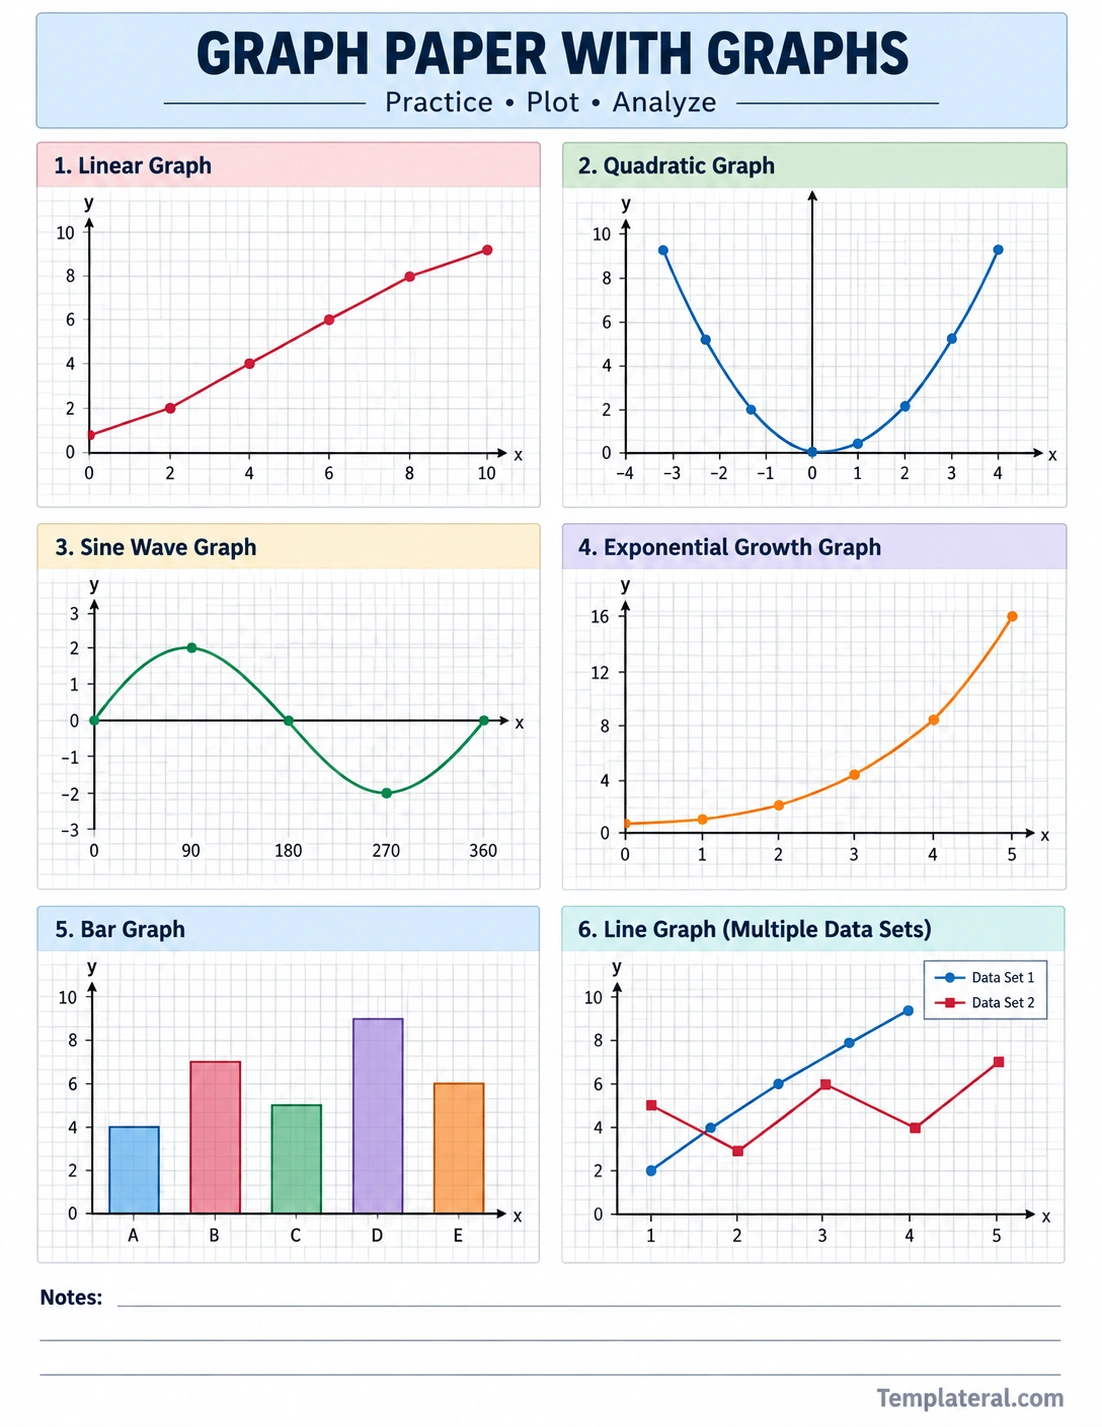
Types of Graphs Commonly Shown on Graph Paper
Different graphs communicate different types of information. Including several examples on one printable worksheet gives learners an opportunity to compare their structures and understand when each type may be useful.
Linear Graph
A linear graph represents a relationship that follows a straight-line pattern. Points are plotted on the coordinate plane and connected to show the relationship between variables.
Linear graphs are commonly used when studying slope, intercepts, rates of change, equations, and relationships between two variables. They are also useful for introducing students to the basic concepts of coordinate graphs.
Quadratic Graph
A quadratic graph typically creates a curved shape called a parabola. Unlike a linear graph, the rate of change is not constant.
Quadratic graphs are commonly associated with equations containing a variable raised to the second power. A plotted example can help students recognize features such as the vertex, axis of symmetry, and direction of the curve.
Sine Wave Graph
A sine graph displays a repeating wave pattern. It is useful for demonstrating periodic behavior and concepts such as amplitude, cycles, and phase.
Students may encounter sine graphs in trigonometry, physics, engineering, and other mathematical applications. A graph-paper example makes the repeating pattern easier to observe.
Exponential Growth Graph
An exponential graph shows a value that changes at an increasingly rapid rate. The curve typically becomes steeper as the independent variable increases.
Exponential models can be used to study concepts such as population growth, compound change, and other processes where a quantity changes by a consistent percentage or factor.
Bar Graph
A bar graph uses separate bars to compare values across categories. It is particularly useful for displaying discrete data in an easy-to-read format.
Unlike a line graph, a bar graph does not require a continuous connection between categories. The height or length of each bar represents the corresponding value.
Multiple-Line Graph
A multiple-line graph displays two or more data sets on the same coordinate system. Different lines can be compared to identify similarities, differences, increases, decreases, and trends.
This type of graph is particularly helpful when comparing two related sets of measurements over the same period or across the same categories.
Why Use Graph Paper With Graphs?
Completed graph examples can make abstract mathematical concepts more visual. Instead of learning only from formulas or written explanations, students can see how values translate into points, curves, lines, and other graphical patterns.
Graph paper with graphs can be useful for several purposes:
- Learning: Students can study completed examples before creating their own graphs.
- Practice: Examples can provide a model for plotting similar data.
- Review: Teachers can use the worksheet as a quick reference during lessons.
- Comparison: Multiple graph types can be viewed side by side.
- Analysis: Learners can identify trends, relationships, and changes in data.
- Reference: A printed worksheet can remain available during homework or classroom activities.
How to Read a Graph on Graph Paper
Before interpreting a graph, start by examining its basic components. Understanding the axes, scale, labels, and plotted information will make the graph easier to interpret.
Identify the X-Axis and Y-Axis
The horizontal axis is generally called the x-axis, while the vertical axis is called the y-axis. Each axis represents a variable or category.
For a coordinate graph, the x-axis commonly represents the independent variable, while the y-axis represents the dependent variable. However, the meaning of each axis depends on the specific data being presented.
Check the Scale
Look at the numbers along each axis and determine how much each grid interval represents. One square might represent one unit, while another graph may use two, five, ten, or another value per interval.
Always check the scale before interpreting the position of a point. A visual distance on the page does not necessarily represent the same numerical value on every graph.
Study the Pattern
Once the axes and scale are clear, examine the overall pattern. Ask whether the graph rises, falls, remains relatively constant, curves, or repeats a cycle.
For example, a straight line may indicate a consistent rate of change, while an upward-curving line may indicate accelerating growth.
How to Use a Printable Graph Worksheet
A printable graph paper worksheet can be used in several ways depending on the learner’s goals. It can function as a reference sheet, practice activity, classroom handout, or study aid.
Study the Completed Examples
Start by examining each graph. Identify the axes, labels, data points, and overall shape. Compare the different graphs and consider how their visual patterns differ.
Plot Similar Data
After studying an example, use a blank section of graph paper to plot a similar data set. This allows the learner to apply the visual pattern rather than simply memorizing a definition.
Label the Graph
Practice adding an appropriate title, axis labels, units, and other necessary information. A graph is much more useful when another person can understand what the plotted information represents.
Analyze the Results
After plotting the data, describe what the graph shows. Look for increases, decreases, peaks, low points, intersections, clusters, or repeating patterns.
Graph Paper With Graphs for Math Practice
Math students can use graph examples to reinforce several concepts at once. A single worksheet can provide visual references for coordinate geometry, functions, equations, and data analysis.
For example, when learning linear equations, a student can compare an equation with its plotted line. When studying quadratic functions, the learner can examine how changes in an equation affect the shape and position of the parabola.
Graph worksheets are also useful for practicing coordinate pairs. Students can identify the approximate location of a point and then determine its corresponding x and y values.
Graph Paper With Graphs for Science and Data Analysis
Graph paper is not limited to mathematics. Science students frequently need to organize experimental observations and display measurements visually.
A graph can help show how one variable changes in response to another. For example, students might plot measurements collected during an experiment and then examine the resulting pattern.
Using a consistent grid makes it easier to compare values and identify trends. The completed examples can also help students decide which type of graph is appropriate for a particular set of data.
Tips for Creating Accurate Graphs
Whether you are using printable graph paper or creating a graph digitally, accuracy and readability are important.
- Choose an appropriate scale: Make sure the axis intervals are suitable for the range of your data.
- Label both axes: Include variable names and units when applicable.
- Plot points carefully: Use the grid intersections to improve accuracy.
- Use a clear title: Describe what the graph represents.
- Keep the layout organized: Avoid unnecessary visual elements that make the data harder to read.
- Check your data: Compare plotted points with the original values before finalizing the graph.
Benefits of Printable Graph Examples
Printable graph examples offer a convenient way to keep visual references available without requiring a digital device. They can be printed at home, used in classrooms, or placed in a study folder for later reference.
A printable worksheet can also be reused for different learning activities. One student might use it to identify graph types, while another might use it to practice interpreting axes and trends.
Teachers can also incorporate graph examples into lessons by asking students to identify similarities and differences between the graphs before introducing the underlying mathematical concepts.
How to Choose the Right Graph Type
The type of graph should match the type of information being presented. Choosing an appropriate format makes the resulting data easier to understand.
- Use a line graph when showing changes or trends across an ordered variable.
- Use a bar graph when comparing values across distinct categories.
- Use a quadratic graph when representing a quadratic relationship.
- Use a sine graph when demonstrating periodic or repeating behavior.
- Use an exponential graph when representing exponential change.
- Use multiple lines when comparing two or more related data sets.
The correct choice depends on the data and the question you are trying to answer. A graph should make the important relationship easier to see rather than simply adding a visual element to a worksheet.
Ideas for Using Graph Paper With Graphs
There are many ways to incorporate a graph-paper reference sheet into learning and practice activities.
- Use completed graphs as examples before beginning a new assignment.
- Ask students to identify the type of each graph.
- Have learners describe the trend shown by each graph.
- Practice identifying coordinates from plotted points.
- Compare two graphs and describe their differences.
- Use the examples as models for creating graphs from a data table.
- Ask students to predict what a graph might look like before plotting it.
- Use printed examples as a quick study reference before a math test.
Conclusion
Graph paper with graphs provides a practical visual tool for learning, practicing, and understanding different types of graphs. By combining a structured grid with completed examples, it helps learners see how numerical information becomes a visual representation.
From linear and quadratic functions to sine waves, exponential growth, bar graphs, and multiple data sets, different graph types can demonstrate a wide range of mathematical and data-analysis concepts. A printable reference sheet can be particularly useful because it provides an easy-to-access model for studying and practice.
Whether you are a student learning graphing fundamentals, a teacher preparing classroom materials, or someone who needs a simple reference, a well-organized graph paper worksheet can make graphing concepts easier to explore and understand.
