A fishbone diagram is a practical problem-solving tool used to identify, organize, and investigate the possible causes of a specific problem. Also known as an Ishikawa diagram or cause and effect diagram, it helps teams look beyond the obvious symptoms and examine the factors that may be contributing to an unwanted result.
The diagram gets its name from its distinctive shape, which resembles the skeleton of a fish. The problem or effect is placed at the head, while possible causes branch from a central line like bones. Because the information is displayed visually, a fishbone diagram can make complex problems easier to analyze and discuss.
Whether you are working in manufacturing, healthcare, education, project management, business operations, or quality improvement, this simple worksheet can provide a structured starting point for root cause analysis.
What Is a Fishbone Diagram?
A fishbone diagram is a visual framework for organizing possible causes of a problem. The main problem is written at one end of the diagram, and major categories of potential causes extend from the central line.
Each category can then be divided into more specific causes. This creates a logical structure that allows a team to move from broad possibilities to individual factors that may need further investigation.
For example, if a manufacturing company is experiencing defective products, the team might investigate people, processes, equipment, materials, environment, and measurement. Each category can contain several possible contributing factors.
The purpose is not to prove that every listed cause is responsible for the problem. Instead, the diagram helps generate and organize hypotheses that can later be investigated using evidence.
Why Use a Fishbone Diagram?
Problems often have multiple contributing factors. Looking at only one obvious cause can result in a temporary solution while the underlying issue remains. A cause and effect diagram provides a more systematic way to examine the situation.
- Organizes ideas: Possible causes are grouped into logical categories.
- Encourages structured thinking: Teams can examine several dimensions of a problem instead of focusing on one explanation.
- Supports root cause analysis: The diagram provides a framework for investigating why a problem occurred.
- Improves team discussions: Participants can see suggestions and relationships in one place.
- Highlights gaps: Categories with few possible causes may indicate areas that need additional investigation.
- Documents the analysis: A completed diagram can become part of a quality improvement or problem-solving record.
Fishbone Diagram Template
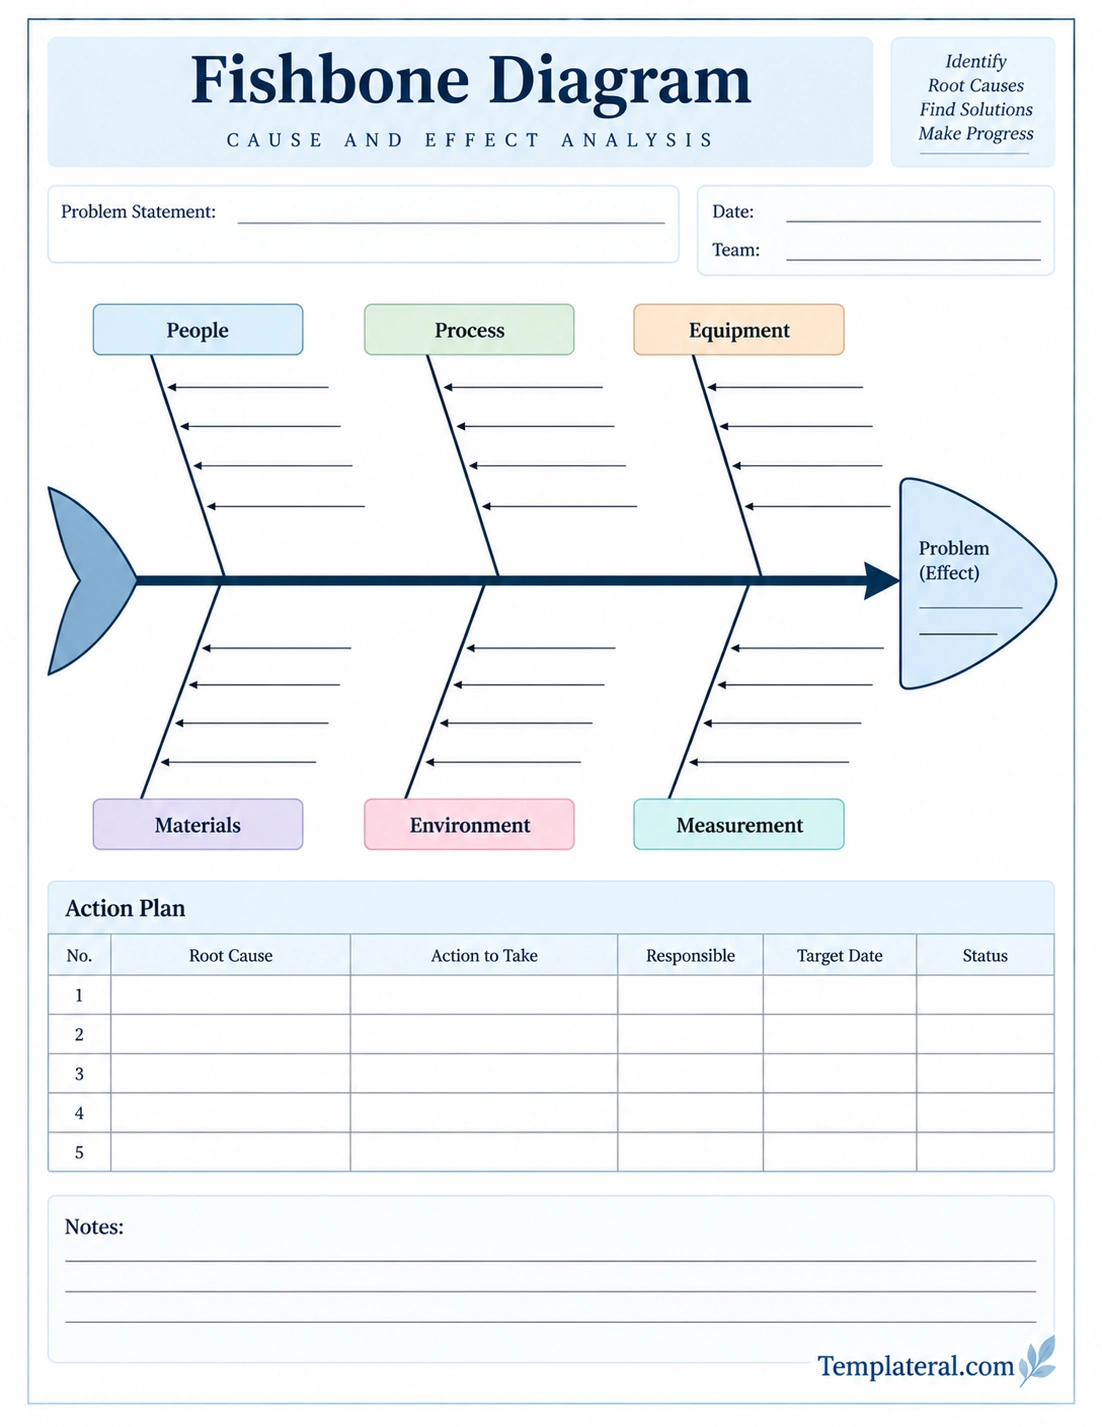
A printable fishbone diagram template provides a ready-to-use structure for conducting cause and effect analysis. Instead of drawing the diagram manually, you can write the problem statement and add possible causes under the appropriate categories.
Parts of a Fishbone Diagram
Although fishbone diagrams can be customized for different situations, most contain several basic elements.
Problem or Effect
The problem statement represents the effect that needs to be investigated. It is usually placed at the right side of the diagram. The statement should be specific enough to guide the analysis.
Instead of writing a broad statement such as “quality problem,” a more useful statement might be “increased product defects during final inspection.”
Central Spine
The central horizontal line connects the potential causes to the problem. Major cause categories branch from this line.
Cause Categories
Cause categories help organize possible explanations. Common categories vary depending on the industry, but manufacturing and quality teams often use the six M categories: Man, Machine, Method, Material, Measurement, and Mother Nature or Environment.
Sub-Causes
Sub-causes provide additional detail beneath each major category. A category such as equipment might contain machine maintenance, calibration, settings, wear, or operating conditions as possible contributing factors.
The 6M Fishbone Diagram
The 6M approach is one of the most recognized ways to organize causes in a manufacturing or quality-related fishbone analysis.
Man or People
This category considers factors related to people involved in the process. Examples may include training, staffing, communication, experience, workload, or unclear responsibilities.
Machine or Equipment
Equipment-related causes can include machine failures, incorrect settings, inadequate maintenance, worn components, calibration problems, or unsuitable equipment.
Method or Process
This category examines how work is performed. Possible causes include unclear procedures, inconsistent workflows, inefficient processes, missing instructions, or changes in operating procedures.
Material
Material-related factors can involve raw materials, components, supplies, packaging, or other physical inputs. Examples include incorrect specifications, contamination, variation, shortages, or poor storage conditions.
Measurement
Measurement considers whether data collection and measurement systems are accurate and appropriate. Potential issues include inaccurate instruments, inconsistent measurements, incorrect sampling, or unclear performance criteria.
Environment
Environmental conditions may affect the process or outcome. Depending on the situation, this can include temperature, humidity, lighting, workspace conditions, noise, cleanliness, or other external factors.
How to Create a Fishbone Diagram
Creating a fishbone diagram does not require complicated software. A paper worksheet can be enough for a small team or individual analysis.
Define the Problem
Start by clearly describing the problem or effect. Avoid vague language. A precise problem statement gives the team a specific issue to investigate.
Identify Major Cause Categories
Choose categories that make sense for the problem. You can use the traditional 6M categories or create categories that are more relevant to your industry or situation.
Brainstorm Potential Causes
List possible causes under each category. Encourage participants to suggest factors without immediately judging whether they are correct. The goal at this stage is to create a broad set of possibilities.
Break Causes Into Sub-Causes
For important causes, ask additional questions to identify more specific contributing factors. This can reveal relationships that are not immediately visible.
Investigate the Most Relevant Causes
Once the diagram is populated, identify causes that require further investigation. Use available data, observations, records, measurements, or testing to determine which factors are actually contributing to the problem.
Develop Corrective Actions
After potential root causes have been verified, determine what actions can address them. A corrective action should target the underlying cause rather than simply treating the visible symptom.
Fishbone Diagram and Root Cause Analysis
A fishbone diagram is often associated with root cause analysis, but the diagram itself does not automatically identify the root cause. It is primarily a tool for organizing possible causes and guiding investigation.
For example, suppose customer complaints have increased because orders are being shipped incorrectly. A team might identify several possible causes, including confusing labels, inadequate training, outdated software, warehouse layout, or unclear procedures.
These possibilities should then be tested against evidence. The team can review order records, observe the workflow, interview employees, or examine system data. The fishbone diagram helps organize this investigation, while evidence determines which causes deserve corrective action.
Fishbone Diagram Examples
Manufacturing Example
A manufacturer experiencing an increase in defective products could use categories such as people, equipment, process, materials, measurement, and environment. Under equipment, the team might investigate machine calibration and maintenance. Under materials, they might examine supplier quality and material specifications.
Business Process Example
A company experiencing delayed customer orders could examine staffing, workflow, software, communication, supplier issues, and approval procedures. The diagram helps the team identify whether delays originate from one part of the process or several interconnected factors.
Education Example
A teacher or school team investigating declining assignment completion could examine factors such as instructions, workload, technology, student support, scheduling, communication, and classroom processes. The diagram can help organize observations before deciding what changes should be tested.
Project Management Example
If a project repeatedly misses deadlines, the team could examine planning, resources, communication, dependencies, requirements, tools, and decision-making. Potential causes can then be investigated rather than assuming that the problem is simply poor time management.
Tips for Using a Fishbone Diagram Effectively
A fishbone diagram is most useful when it leads to meaningful investigation rather than becoming a simple brainstorming exercise.
- Define the problem precisely: A specific problem produces more useful causes.
- Use evidence: Treat possible causes as hypotheses until they can be supported by data or observation.
- Include different perspectives: People who work at different stages of a process may notice different contributing factors.
- Ask why repeatedly: Dig deeper into important causes instead of stopping at the first explanation.
- Avoid blaming individuals: Focus on processes, conditions, systems, and other factors that can be investigated and improved.
- Keep the diagram readable: If too many details are added, use additional notes or supporting documents.
- Connect findings to actions: Document what should happen after important causes have been identified.
Fishbone Diagram vs. 5 Whys
The fishbone diagram and the 5 Whys technique are both commonly used for problem solving, but they serve somewhat different purposes.
A fishbone diagram helps organize multiple possible causes across several categories. It is useful when a problem may have numerous contributing factors.
The 5 Whys technique focuses on repeatedly asking why a problem occurred to explore a particular chain of cause and effect. The two methods can be used together. A team might use a fishbone diagram to identify possible causes and then apply the 5 Whys technique to investigate selected causes more deeply.
When Should You Use a Fishbone Diagram?
A fishbone diagram can be useful whenever a problem has several possible causes and the team needs a structured way to explore them.
- Recurring quality problems
- Production defects
- Customer complaints
- Process delays
- Project failures
- Service problems
- Workplace process issues
- Operational inefficiencies
- Unexpected performance changes
- Continuous improvement projects
It is less useful when the cause of a problem is already clearly established and requires no further investigation. In those cases, the time may be better spent implementing and monitoring the appropriate solution.
How to Use a Printable Fishbone Diagram Worksheet
A printable worksheet can be particularly useful during team meetings, quality reviews, classroom activities, or process improvement sessions. Print one copy for the group or provide individual copies before combining the results.
Begin by writing the problem statement in the designated area. Add the major categories around the central diagram, then record possible causes on the corresponding branches. After the brainstorming session, review the causes and identify those that need additional evidence.
The action plan section can then be used to record selected root causes, corrective actions, responsible parties, target dates, and status. This turns the worksheet from a brainstorming tool into a practical follow-up document.
Common Mistakes When Creating a Fishbone Diagram
Using a Vague Problem Statement
A vague problem makes it difficult to determine which causes are relevant. Describe the specific result, process, product, location, or time period whenever possible.
Stopping at Symptoms
A symptom describes what is happening, but it may not explain why it is happening. Continue investigating important causes until you reach factors that can reasonably be addressed.
Listing Causes Without Verification
Not every item on a fishbone diagram is a confirmed cause. Use data and observation to distinguish possibilities from verified contributing factors.
Focusing on Individual Blame
Effective root cause analysis looks at the broader system. Training, procedures, equipment, workload, communication, and process design may all influence an outcome.
Failing to Follow Up
A completed diagram is not the end of the problem-solving process. The most important step is using the findings to implement corrective actions and determine whether those actions actually improve the situation.
Conclusion
A fishbone diagram is a straightforward but powerful tool for organizing possible causes of a problem. By separating potential causes into categories and examining them systematically, teams can move beyond surface-level symptoms and investigate the factors that may be responsible for an unwanted result.
Whether you use an Ishikawa diagram for manufacturing, quality management, business processes, education, or project management, the basic approach remains the same: define the problem, identify possible causes, investigate the evidence, and turn verified findings into practical actions.
A printable fishbone diagram template makes this process easy to start. With a clear problem statement, organized cause categories, and space for an action plan, the worksheet can become a useful part of structured problem solving and continuous improvement.
Download: Fishbone Diagram Template
