An organizational chart is a visual representation of how an organization is structured. It shows the relationships between departments, teams, managers, employees, and leadership positions. By presenting reporting relationships in a clear format, an organizational chart can help employees understand who is responsible for different areas of the organization and how teams work together.
Organizations of all sizes can benefit from a well-designed organizational structure. A small business may need a simple chart showing the owner, managers, and key employees, while a large company may require multiple levels covering executives, departments, divisions, and specialized teams. A clear chart can make complex reporting relationships easier to understand and maintain.
What Is an Organizational Chart?
An organizational chart, sometimes called an org chart, is a diagram that illustrates the formal structure of an organization. It commonly uses boxes, lines, and labels to show positions and reporting relationships.
The highest-level position is usually displayed near the top of the chart. Managers and departments may appear below that position, followed by supervisors, teams, or individual roles. The exact arrangement depends on the organization’s structure.
An organizational chart can show more than names. It can include job titles, departments, responsibilities, reporting relationships, and other information that helps explain how the organization operates.
Why Is an Organizational Chart Important?
A clear organizational structure can make it easier for employees and stakeholders to understand how responsibilities are distributed. Without a visual structure, people may have difficulty determining who manages a particular function or where a specific role belongs.
An organizational chart can help an organization:
- Clarify reporting relationships.
- Show management levels.
- Define departmental structures.
- Explain areas of responsibility.
- Help new employees understand the organization.
- Improve communication between teams.
- Support workforce planning.
- Identify gaps or overlapping responsibilities.
- Document organizational changes.
- Provide a quick reference for employees and stakeholders.
An organizational chart is not a replacement for detailed job descriptions or internal policies. Instead, it provides a high-level visual overview of how roles and teams are connected.
Common Types of Organizational Charts
Organizations use different types of organizational charts depending on how authority, departments, and teams are arranged.
Hierarchical Organizational Chart
A hierarchical organizational chart is one of the most common formats. It typically places the highest leadership position at the top and displays lower levels beneath it.
This structure makes reporting relationships easy to follow. It is often suitable for organizations with clearly defined management levels.
Functional Organizational Chart
A functional organizational chart groups employees according to their areas of expertise or business functions. Common departments may include finance, human resources, operations, marketing, sales, information technology, and customer service.
This approach makes it easier to see how specialized functions are organized within the business.
Divisional Organizational Chart
A divisional structure separates the organization into business units, geographic regions, product categories, or customer groups.
Each division may have its own leadership and supporting functions. This format can be useful for organizations that operate across multiple markets or product lines.
Matrix Organizational Chart
A matrix organizational structure allows employees to work across functional and project-based teams. An employee may have a functional manager while also working under a project manager for a particular initiative.
Because matrix relationships can be more complex, the chart should clearly distinguish different types of reporting or collaboration relationships.
Flat Organizational Chart
A flat organizational structure has fewer management layers between leadership and employees. The chart may contain fewer levels and emphasize collaboration and direct communication.
This format is often used by smaller organizations or teams that have intentionally limited management layers.
Key Elements of an Organizational Chart
A useful organizational chart should provide enough information to understand the structure without becoming difficult to read. Several elements are commonly included.
Position or Role
Each box should identify a position, role, or organizational unit. Examples include Chief Executive Officer, Operations Manager, Accounting, Marketing Manager, or Customer Support.
Employee Name
Organizations may include the name of the person currently holding each position. Including names can make the chart more useful as an internal directory, although role-only charts can be easier to maintain when staff changes frequently.
Department
Department labels can show how functions are grouped within the organization. Color coding or separate sections can sometimes make departments easier to distinguish.
Reporting Lines
Connecting lines indicate relationships between positions. A straightforward hierarchy typically uses vertical lines to show who reports to whom.
Management Levels
Different levels can show executive leadership, department managers, supervisors, and individual contributors. Consistent spacing and formatting can make these levels easier to recognize.
Organizational Chart Template
An organizational chart template provides a ready-to-use framework for mapping an organization’s structure. Instead of designing the chart from an empty page, users can fill in existing sections with positions, names, departments, and reporting relationships.
A printable organizational chart can be particularly useful for business planning, employee onboarding, management meetings, department reviews, and documenting organizational changes.
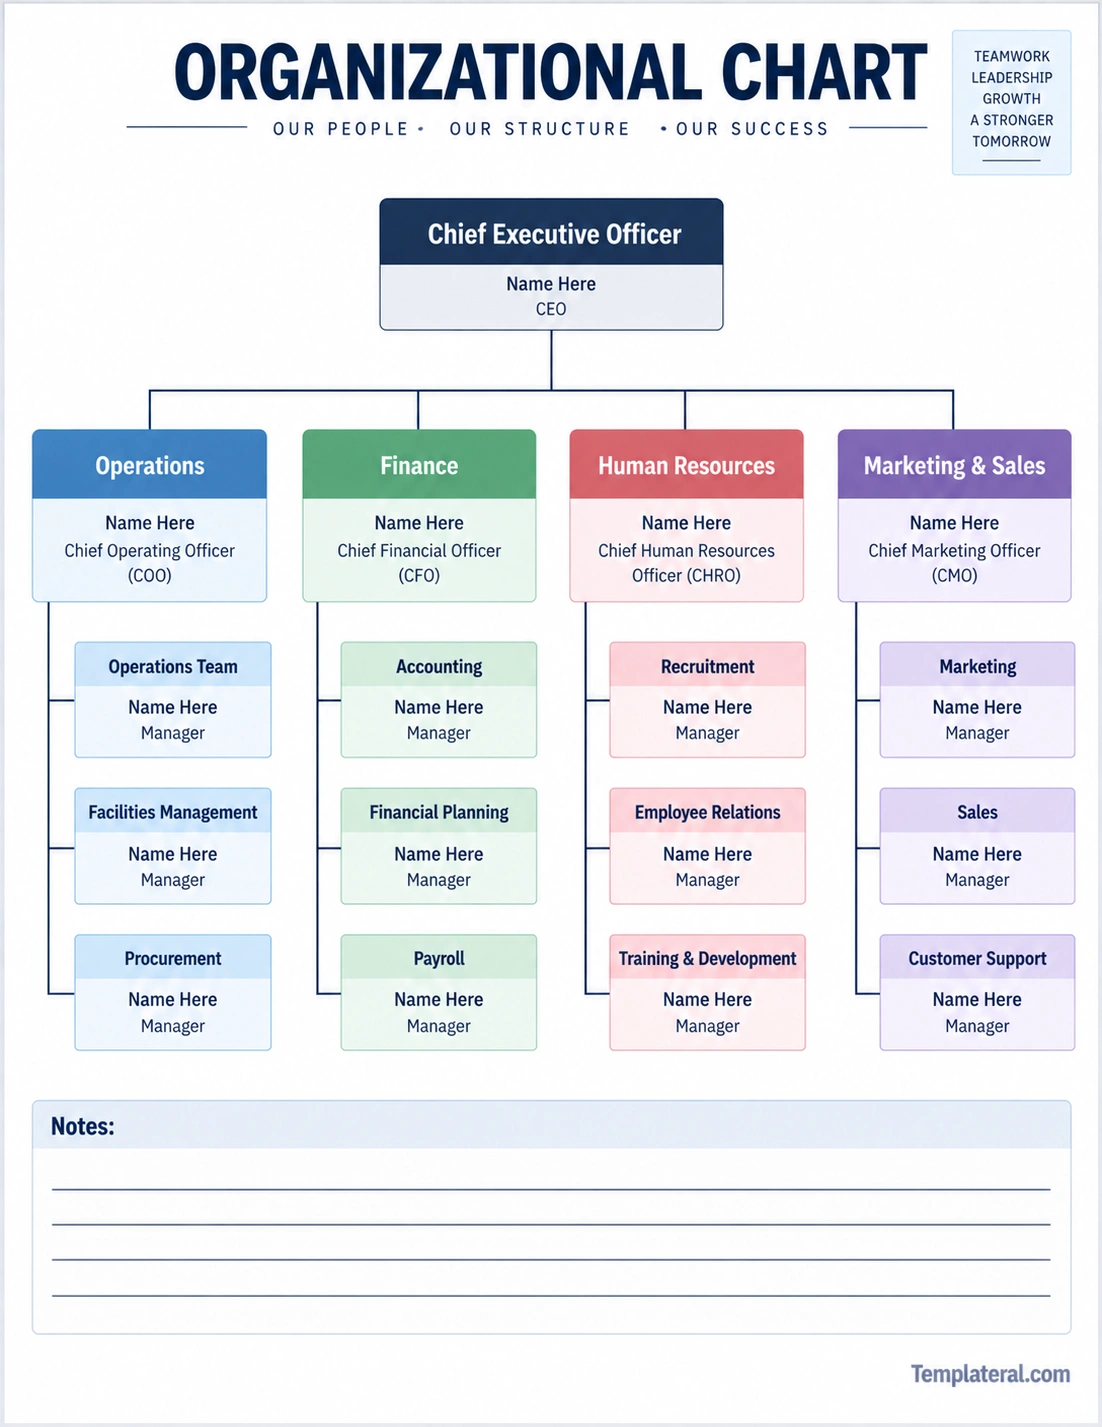
The template can be customized to fit different business structures. Users can replace placeholder names and positions, add departments, remove unnecessary sections, or use the layout as a starting point for creating a digital organizational chart.
How to Create an Organizational Chart
Creating an organizational chart becomes easier when the structure is planned before the visual design begins. Follow these steps to create a chart that is accurate and easy to understand.
1. Define the Purpose
First, determine why you are creating the chart. An internal employee directory may need names and contact information, while a management structure chart may focus primarily on positions and reporting relationships.
Knowing the purpose helps determine what information should be included.
2. Identify Leadership
Start with the organization’s highest relevant leadership position. This could be a CEO, president, owner, executive director, or another senior role.
Place this position at the top of a hierarchical chart.
3. List Departments
Identify the major departments or business functions. Examples may include operations, finance, human resources, marketing, sales, information technology, and customer support.
4. Add Managers and Teams
Place department managers or functional leaders beneath the appropriate executive or senior manager. Then add teams and subordinate roles below them.
5. Establish Reporting Relationships
Use connecting lines to show formal reporting relationships. Make sure each connection represents an actual organizational relationship rather than simply a collaboration or communication link.
6. Review the Structure
Ask department leaders or other appropriate stakeholders to review the chart. Verify names, titles, departments, and reporting relationships before distributing it.
7. Format the Chart Clearly
Use consistent box sizes, typography, spacing, and connection lines. If colors are used, apply them consistently to departments or organizational levels.
How to Organize an Organizational Chart
The visual layout should make the structure easy to follow. Start with the highest-level role and work downward through the organization.
For example, a basic company structure might look conceptually like this:
- Chief Executive Officer
- Operations Department
- Operations Manager
- Operations Team
- Facilities Management
- Finance Department
- Finance Manager
- Accounting Team
- Payroll Team
- Human Resources Department
- HR Manager
- Recruitment Team
- Employee Relations
- Marketing and Sales Department
- Marketing Manager
- Sales Team
- Customer Support
The actual structure should reflect the organization’s real reporting relationships rather than forcing every business into the same model.
Organizational Chart for Small Businesses
A small business organizational chart does not need to contain dozens of positions. A simple chart can show the owner or executive, managers, major departments, and employees.
Small businesses may have employees who perform multiple functions. For example, one person might handle both marketing and customer service. In such cases, the chart should reflect the actual responsibilities and reporting relationships clearly.
A simple chart can also be useful when a business is growing. It can show the current structure and help management think about future roles and responsibilities.
Organizational Chart for Large Companies
Large organizations often have complex structures with multiple management layers, business units, locations, and specialized functions.
Trying to display the entire company on one page may make the chart difficult to read. A better approach can be to create a high-level corporate chart and separate charts for individual departments or divisions.
Department-level charts can provide more detail without overwhelming the reader with information that is not relevant to their immediate responsibilities.
Organizational Chart vs. Organizational Structure
An organizational structure describes how authority, responsibilities, functions, and relationships are arranged within an organization. An organizational chart is a visual representation of that structure.
In other words, the structure is the underlying arrangement, while the chart is one way of communicating that arrangement.
A chart can therefore be updated when the organization’s structure changes. It should accurately reflect the current arrangement rather than an outdated version of the business.
Benefits of Using an Organizational Chart Template
A template can simplify the process of creating and maintaining an organizational chart.
- Saves preparation time: Predefined sections provide a starting point.
- Improves consistency: Standard formatting makes charts easier to read.
- Supports planning: Empty positions can highlight future staffing needs.
- Helps onboarding: New employees can quickly see the organizational structure.
- Improves communication: Employees can better understand where functions and responsibilities belong.
- Provides a reference: Teams can use the chart during meetings and organizational reviews.
Common Organizational Chart Mistakes
A chart can become confusing when too much information is included or when reporting relationships are inaccurate.
Including Too Much Information
An organizational chart should provide a clear overview. Detailed job descriptions, lengthy responsibilities, and unrelated information can make the chart difficult to read.
Using Inconsistent Formatting
Different box sizes, fonts, spacing, and connection styles can make the structure harder to understand. Consistent formatting creates a clearer visual hierarchy.
Showing Outdated Information
An organizational chart becomes less useful when employees move between departments, managers change, or positions are eliminated but the chart is not updated.
Confusing Collaboration With Reporting
Not every working relationship is a formal reporting relationship. Make sure lines and symbols communicate the intended type of relationship.
Creating an Overly Complex Chart
Large organizations may need multiple charts instead of one extremely detailed diagram. Breaking information into logical levels can improve readability.
Tips for Maintaining an Organizational Chart
An organizational chart should be reviewed whenever significant organizational changes occur. A simple maintenance process can help keep the information accurate.
- Review the chart after major staffing changes.
- Update job titles when positions change.
- Remove employees who leave the organization.
- Add newly created departments or roles.
- Verify reporting relationships with managers.
- Use consistent naming and formatting.
- Include a revision date when appropriate.
- Keep older versions when organizational history needs to be documented.
Frequently Asked Questions About Organizational Charts
What is the purpose of an organizational chart?
The purpose of an organizational chart is to visually communicate the structure of an organization, including positions, departments, management levels, and reporting relationships.
What should an organizational chart include?
An organizational chart may include job titles, employee names, departments, managers, teams, and reporting relationships. The information included should match the purpose of the chart.
What is an organizational chart template?
An organizational chart template is a pre-designed framework that helps users create an organizational structure diagram. It can contain placeholder positions, departments, management levels, and areas for notes or additional information.
Can a small business use an organizational chart?
Yes. Small businesses can use a simple organizational chart to show the owner, managers, employees, departments, and reporting relationships. The chart can also help visualize future staffing needs as the business grows.
How often should an organizational chart be updated?
An organizational chart should be updated whenever important changes occur in leadership, staffing, departments, job titles, or reporting relationships. Organizations may also schedule periodic reviews to verify that the chart remains accurate.
Can an organizational chart include vacant positions?
Yes. Showing vacant positions can be useful for workforce planning. A clear label such as “Vacant” can distinguish an open position from an occupied role.
Conclusion
An organizational chart provides a simple visual way to understand how an organization is structured. By showing leadership positions, departments, teams, and reporting relationships, it can improve clarity and provide employees and stakeholders with a useful reference.
An organizational chart template makes the process easier by providing a structured starting point for documenting an organization’s hierarchy. The template can be adapted for small businesses, departments, nonprofit organizations, corporations, project teams, and other organizational settings.
The most effective chart is one that reflects the organization’s actual structure and presents the information in a clean, easy-to-follow format. By keeping the chart accurate, consistent, and appropriately detailed, organizations can use it as a practical tool for communication, onboarding, workforce planning, and organizational management.
Download: Organizational Chart Template
