Fishbone diagrams, also known as Ishikawa diagrams or cause-and-effect diagrams, are a powerful visual tool that helps teams identify the potential root causes of a problem by brainstorming and categorizing possible factors contributing to an issue.
These diagrams are widely used in various industries, including manufacturing, healthcare, and project management, to systematically analyze complex problems and arrive at effective solutions. In this comprehensive guide, we will explore the what, why, key elements, how to, and tips for using fishbone diagrams effectively.
What is a Fishbone Diagram?
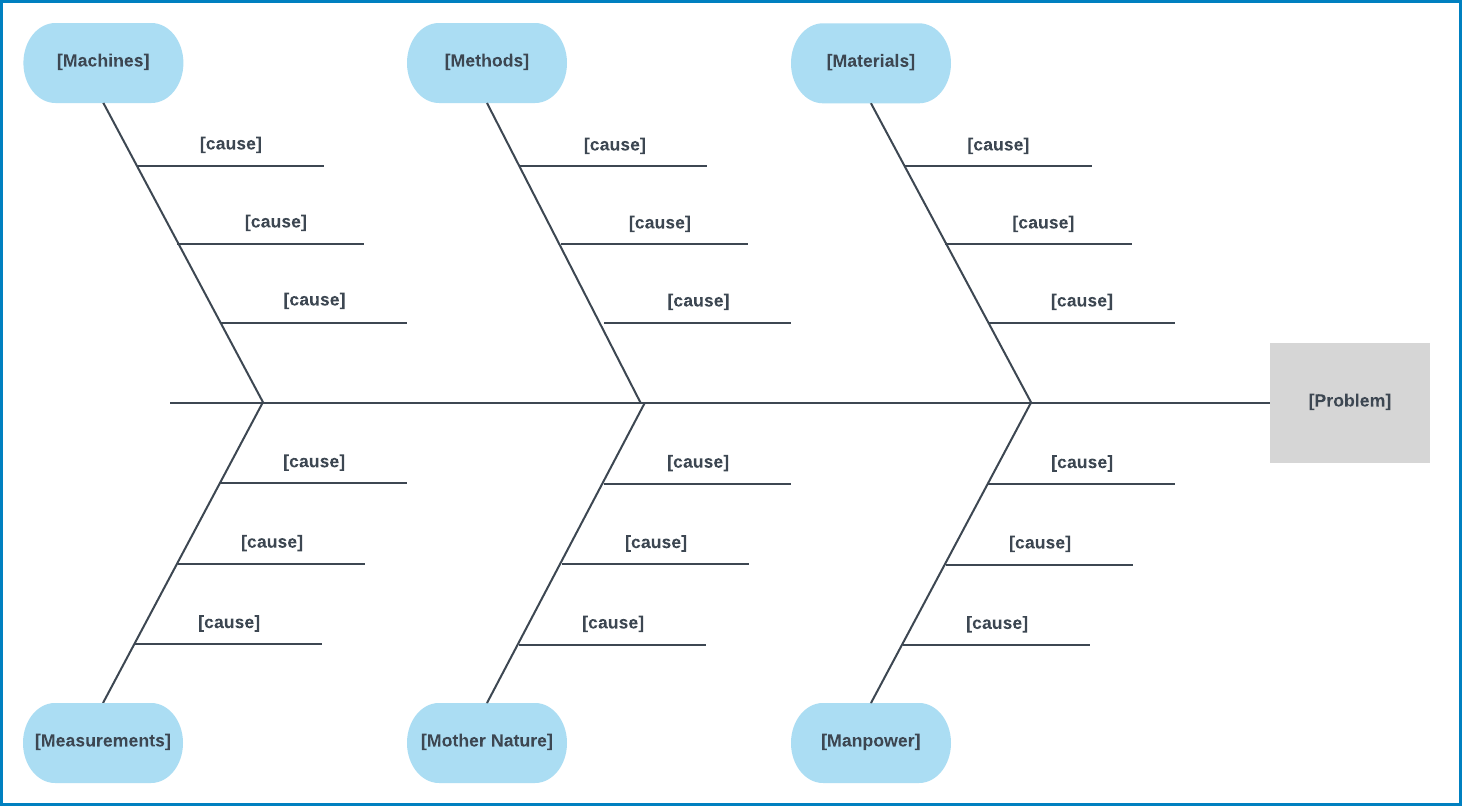
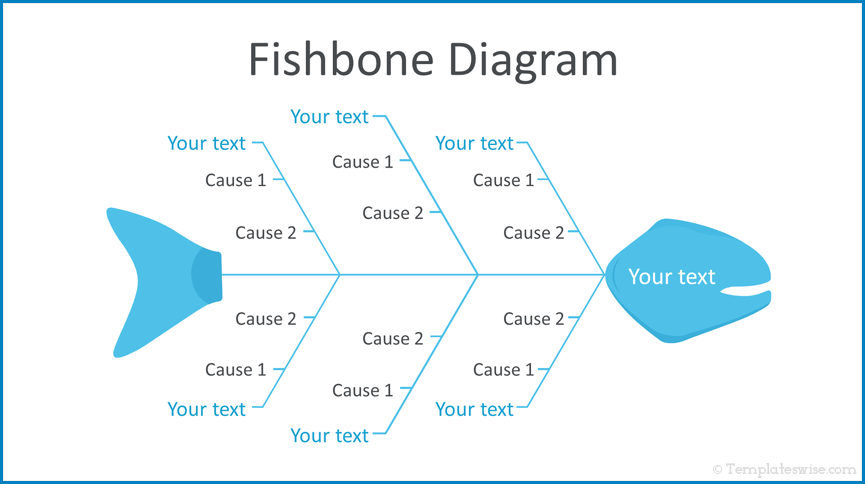
A fishbone diagram is a structured brainstorming tool used to analyze the potential causes of a problem. The diagram gets its name from its appearance, resembling the skeleton of a fish with the problem statement at the head and branches representing different categories of causes.
By visually mapping out all possible causes, teams can gain a better understanding of the relationships between various factors contributing to the problem.
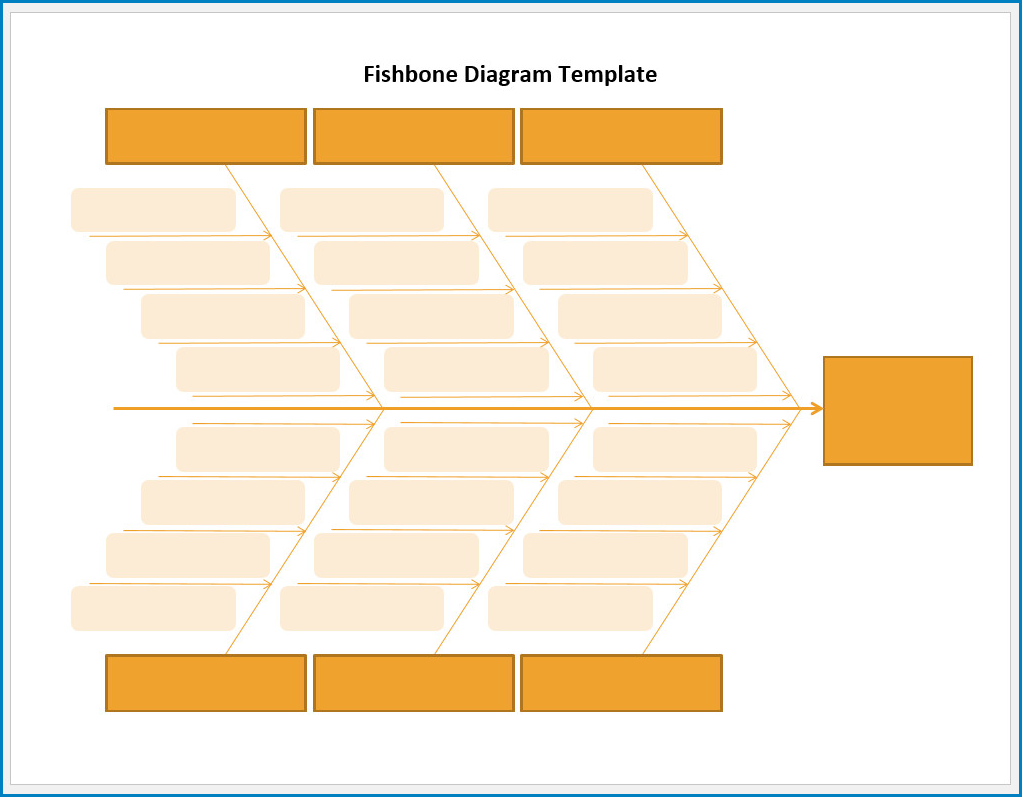
Samples of Fishbone Diagram:


Why Use Fishbone Diagrams?
Teams across industries use fishbone diagrams for various reasons, including:
Problem-Solving Efficiency
One of the key reasons for using fishbone diagrams is their ability to streamline the problem-solving process. By visually mapping out all potential causes, teams can focus their efforts on addressing the most critical factors contributing to the problem. This targeted approach leads to more efficient problem resolution and ultimately saves time and resources.
Team Collaboration
Fishbone diagrams promote collaboration among team members by providing a structured framework for brainstorming and categorizing causes. When team members from different departments or areas of expertise come together to analyze a problem using the diagram, they can leverage their diverse perspectives to identify a comprehensive range of potential causes. This collaborative approach fosters a sense of ownership and teamwork in solving the problem.
Continuous Improvement
Another benefit of using fishbone diagrams is their role in promoting continuous improvement within an organization. By regularly conducting root cause analyses using the diagram, teams can identify recurring issues, implement corrective actions, and monitor the effectiveness of those actions over time. This iterative process of problem-solving leads to ongoing improvements in processes, products, and services.
Key Elements of a Fishbone Diagram
A well-constructed fishbone diagram typically consists of the following key elements:
Problem Statement Clarity
The problem statement is the foundation of a fishbone diagram and should be clearly defined to ensure that all team members have a shared understanding of the issue at hand. Ambiguity or vagueness in the problem statement can lead to misinterpretation and confusion during the analysis phase. Therefore, it is essential to articulate the problem in a concise and specific manner that leaves no room for miscommunication.
Categories and Subcategories
The main categories and subcategories of a fishbone diagram provide a structured framework for organizing potential causes. These categories are typically broad in scope (e.g., Process) and serve as the primary branches from which causes are further classified. Subcategories offer a more detailed breakdown of causes within each main category, helping teams to systematically analyze and categorize factors contributing to the problem.
Brainstorming Potential Causes
One of the critical steps in creating a fishbone diagram is conducting a brainstorming session to generate potential causes. This collaborative exercise involves team members sharing their insights, experiences, and knowledge to identify all possible factors that could be contributing to the problem. Brainstorming encourages creativity and divergent thinking, allowing teams to explore a wide range of ideas and perspectives.
Linking Causes to Categories
As potential causes are identified during the brainstorming session, team members must link each cause to the appropriate category on the diagram. This step ensures that causes are organized and classified correctly, making it easier to analyze their relationships and impact on the problem. By mapping out causes in this way, teams can visually represent the interconnectedness of different factors contributing to the issue.
Analyzing Relationships
Once all potential causes have been mapped out on the fishbone diagram, teams can begin analyzing the relationships between different factors. This analysis involves examining how causes in one category may influence or interact with causes in another category, leading to a more comprehensive understanding of the problem. By identifying these relationships, teams can prioritize their efforts on addressing the most critical and influential causes.
How to Create a Fishbone Diagram
Creating a fishbone diagram involves a series of steps that help teams structure their analysis and systematically identify potential causes. The following steps outline the process of creating a fishbone diagram:
- Define the Problem: Clearly articulate the problem statement that the team is trying to solve. The problem statement should be specific, measurable, achievable, relevant, and time-bound (SMART).
- Identify Main Categories: Determine the primary categories under which potential causes will be classified. Common categories include People, Process, Environment, Equipment, Policies, and Procedures.
- Add Subcategories: Create sub-branches under each main category to further classify causes into more specific groups. Subcategories help teams organize causes and identify patterns or trends.
- Brainstorm Potential Causes: Engage team members in a brainstorming session to identify all possible factors contributing to the problem. Encourage creativity, open-mindedness, and active participation during the brainstorming process.
- Connect Causes to Categories: Map out the potential causes on the diagram, connecting each cause to the appropriate category and subcategory. This step helps teams visually represent the relationships between different causes and categories.
- Analyze Relationships: Analyze the relationships between causes in different categories to understand how they interact and contribute to the problem. Look for common themes, root causes, and underlying issues that may be driving the problem.
Tips for Using Fishbone Diagrams
To maximize the effectiveness of fishbone diagrams in problem-solving, consider the following tips:
Cross-Functional Collaboration
Involving team members from different departments or areas of expertise in the problem-solving process can lead to a more holistic and comprehensive analysis of the problem. Cross-functional collaboration brings together diverse perspectives, skills, and knowledge, enabling teams to identify a broader range of potential causes and solutions. By leveraging the expertise of team members from various backgrounds, organizations can gain unique insights and innovative approaches to problem-solving.
Facilitation for Idea Generation
Facilitation techniques play a crucial role in stimulating idea generation and encouraging active participation during the problem-solving process. Techniques such as brainstorming, mind mapping, or affinity diagrams can help teams explore different angles of the problem, uncover hidden causes, and generate creative solutions. Facilitation creates a supportive environment for team members to express their ideas freely and collaborate effectively towards achieving a common goal.
Focus on Impactful Causes
When analyzing potential causes on the fishbone diagram, teams should prioritize causes that have the most significant impact on the problem. By focusing on the most critical factors, teams can allocate their resources, time, and efforts more efficiently towards addressing root causes and achieving sustainable solutions. Prioritizing impactful causes helps teams to avoid getting lost in minor details and ensures that their interventions have a meaningful impact on the problem.
Continuous Improvement Mindset
Embracing a continuous improvement mindset is essential for leveraging the full potential of fishbone diagrams in problem-solving. Teams should view the diagram as a dynamic tool that evolves with new insights and information. By continuously refining and updating the diagram, teams can adapt to changing circumstances, monitor the effectiveness of their solutions, and drive ongoing improvements in processes, products, and services.
Fishbone Diagram Template
A fishbone diagram is a powerful tool for identifying the root causes of problems in a clear and organized way. Also known as an Ishikawa or cause-and-effect diagram, it helps teams visually map out potential factors contributing to an issue, making it easier to analyze and find effective solutions. Ideal for business, manufacturing, and project management, this template promotes structured problem-solving and collaboration.
Download and use our fishbone diagram template today to uncover root causes and drive smarter, more effective solutions.
Fishbone Diagram Template | Word – download
