A sugar level chart is a simple way to understand blood glucose readings and organize information about blood sugar levels. It can help you compare common reference ranges, track readings throughout the day, and understand how measurements may relate to normal blood sugar, prediabetes, or diabetes.
Blood sugar is not constant. It changes after meals, during physical activity, and in response to factors such as stress, illness, sleep, and medications. Keeping a written record can make these changes easier to recognize. However, a general chart should be used as an educational reference rather than as a substitute for professional medical advice.
What Is a Sugar Level Chart?
A sugar level chart is a reference tool that organizes blood glucose information into easy-to-read categories. Depending on the purpose, it may show fasting glucose levels, blood sugar after eating, A1C results, or personal glucose targets.
Some charts are designed to explain the difference between normal blood sugar, prediabetes, and diabetes. Others are designed as printable blood sugar logs where you can record your own readings by date and time.
A useful sugar level chart can combine both functions. It can provide reference information while also giving you space to track your daily readings and notes.
Sugar Level Chart: Normal, Prediabetes, and Diabetes
The CDC uses several blood glucose tests to identify prediabetes and diabetes. The results depend on the type of test being performed. Common diagnostic ranges include fasting blood glucose, A1C, and the two-hour oral glucose tolerance test.
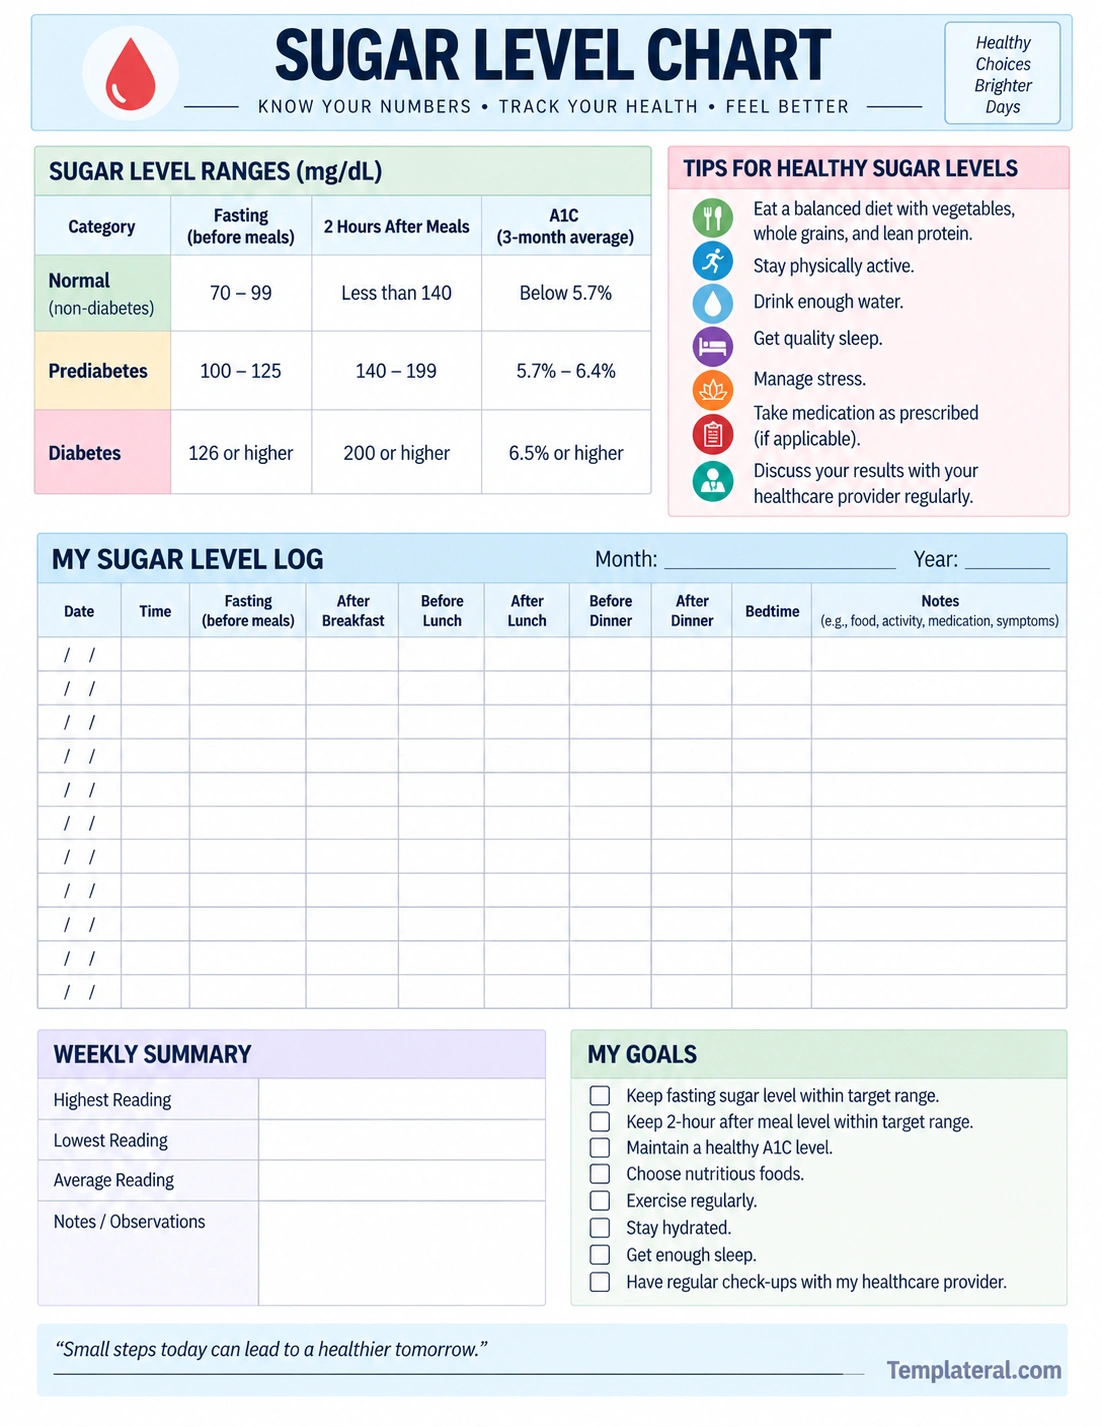
- Fasting blood glucose: 99 mg/dL or below is in the normal range, 100–125 mg/dL is in the prediabetes range, and 126 mg/dL or above is in the diabetes range.
- A1C: Below 5.7% is normal, 5.7%–6.4% is in the prediabetes range, and 6.5% or above is in the diabetes range.
- Two-hour glucose tolerance test: 140 mg/dL or below is normal, 140–199 mg/dL is in the prediabetes range, and 200 mg/dL or above is in the diabetes range.
These values are used for diagnostic testing. A single reading from a home glucose meter should not be treated as a diagnosis. If your results are repeatedly outside the expected range, discuss them with a healthcare professional.
Fasting Sugar Levels Explained
Fasting blood glucose measures blood sugar after an overnight period without eating. It is one of the standard tests used to identify prediabetes and diabetes.
Normal Fasting Sugar
According to the CDC, a fasting blood glucose result of 99 mg/dL or below is within the normal range for diagnostic testing. A fasting result between 100 and 125 mg/dL falls within the prediabetes range. A result of 126 mg/dL or above is within the diabetes range.
These categories help healthcare professionals interpret laboratory testing. They should not be used to diagnose yourself from one home measurement.
Why Fasting Readings Matter
Fasting readings can provide useful information because food has not recently caused a temporary increase in blood glucose. Tracking fasting readings over time can also help identify patterns that may be worth discussing with your healthcare provider.
Blood Sugar Levels After Eating
Blood glucose normally changes after a meal. The size of the change depends on many factors, including the foods eaten, portion size, physical activity, medications, and individual insulin response.
For people with diabetes, the American Diabetes Association recommends individualized glucose targets. For most nonpregnant adults with diabetes, a commonly recommended target is 80–130 mg/dL before a meal and less than 180 mg/dL one to two hours after the beginning of a meal.
These are treatment targets rather than diagnostic thresholds. Your personal target may be different depending on your age, health conditions, diabetes duration, treatment plan, and risk of low blood glucose.
Understanding A1C Levels
A1C is different from a blood glucose meter reading. A meter provides a snapshot of your blood glucose at a particular moment, while an A1C test reflects average blood sugar over approximately the previous two to three months.
- Normal A1C: Below 5.7%
- Prediabetes A1C: 5.7%–6.4%
- Diabetes A1C: 6.5% or above
For people who already have diabetes, A1C goals are individualized. The ADA identifies less than 7% as a common goal for many nonpregnant adults, but healthcare professionals may recommend a different goal for a particular person.
Sugar Level Chart Template
A printable sugar level chart can make daily tracking more convenient. Instead of trying to remember your previous readings, you can write them down immediately and review them later.
The printable template below combines reference information with a daily sugar level log. It includes spaces for fasting readings, readings around meals, bedtime measurements, notes, weekly summaries, and personal goals.
What to Record on a Sugar Level Chart
A detailed log can provide more useful information than a collection of numbers. When appropriate, record the circumstances surrounding each reading.
- Date: Write down the date of the measurement.
- Time: Record when the glucose test was taken.
- Blood sugar reading: Enter the result using the unit displayed by your meter.
- Meal timing: Indicate whether the reading was before or after eating.
- Food notes: Briefly describe an unusual or particularly large meal when relevant.
- Exercise: Record significant physical activity.
- Medication: Note relevant medication information according to your healthcare plan.
- Symptoms: Record unusual symptoms that occur around a reading.
- Other observations: Add notes about illness, stress, travel, sleep, or changes in routine.
How to Use a Sugar Level Chart
1. Follow Your Personal Testing Schedule
Not everyone needs to check blood sugar at the same times. Your testing schedule may depend on whether you have diabetes, the type of treatment you use, and recommendations from your healthcare team.
Follow the schedule provided by your healthcare professional instead of creating a testing routine based solely on a generic chart.
2. Record Your Results Consistently
Try to enter your results shortly after taking a measurement. Consistent records are easier to review than readings reconstructed from memory.
3. Add Useful Context
A blood sugar number becomes more informative when you know what was happening around it. For example, recording a large meal, unusual exercise, illness, or poor sleep may help explain a change in your readings.
4. Look for Repeated Patterns
One unusual reading does not necessarily indicate a long-term problem. Instead, look for repeated patterns over several days or weeks and discuss significant patterns with your healthcare provider.
Factors That Can Change Sugar Levels
Blood glucose can be affected by many aspects of daily life. Two readings taken on different days may be different even when your routine seems similar.
- Meals and carbohydrate intake
- Physical activity
- Stress
- Illness or infection
- Sleep and changes in sleep patterns
- Medications
- Alcohol
- Hormonal changes
- Changes in meal timing
- Changes in your normal daily routine
Recording relevant factors alongside your glucose readings can make your chart more useful when reviewing your results.
Sugar Level Chart for People With Diabetes
People with diabetes may use a sugar level chart as part of their regular glucose monitoring routine. The ADA emphasizes that glucose targets should be individualized. For most nonpregnant adults with diabetes, common targets are 80–130 mg/dL before meals and less than 180 mg/dL one to two hours after the beginning of a meal.
These targets are not universal. Your healthcare provider may recommend a different range based on your age, health status, diabetes treatment, risk of hypoglycemia, and other individual considerations.
Sugar Level Chart for Prediabetes
Prediabetes means blood glucose is higher than the normal range but does not meet the diagnostic threshold for diabetes. Common diagnostic findings include fasting blood glucose of 100–125 mg/dL or an A1C of 5.7%–6.4%.
Prediabetes can often occur without obvious symptoms. If testing shows a result in the prediabetes range, talk with a healthcare professional about appropriate follow-up and lifestyle changes.
Why Track Sugar Levels?
Keeping a glucose record can help you understand how your blood sugar changes throughout the day. It can also give your healthcare provider more information during appointments.
For example, your chart might reveal repeated changes after meals, during periods of low activity, or when your normal schedule changes. Your healthcare team can help determine whether those patterns are meaningful and whether your monitoring or treatment plan needs adjustment.
Sugar Level Chart vs. Blood Sugar Log
The terms sugar level chart and blood sugar log are often used to describe similar resources, but they can have different purposes.
- Sugar level chart: Usually emphasizes reference ranges and explanations of blood glucose levels.
- Blood sugar log: Primarily provides space to record personal glucose readings.
- Printable sugar level chart: Can combine reference information with tracking fields.
- Glucose tracking worksheet: May include additional sections for meals, exercise, symptoms, goals, and notes.
A combined chart and tracking worksheet can be convenient because you can reference general information and record your own readings on the same page.
Tips for Keeping an Accurate Sugar Level Record
- Keep your chart somewhere that is easy to access.
- Record measurements as soon as practical.
- Use the same units displayed by your glucose meter.
- Record whether readings were taken before or after meals.
- Add notes about significant changes in food, exercise, sleep, or health.
- Bring your records to healthcare appointments when requested.
- Use your personal glucose targets rather than assuming a generic range applies to you.
- Review repeated patterns instead of focusing on one isolated reading.
When Should You Discuss Sugar Levels With a Healthcare Provider?
Talk with your healthcare provider if your readings repeatedly fall outside your personal target range, if your usual pattern changes significantly, or if you are concerned about your results.
A healthcare professional can determine whether additional testing is appropriate and explain what your results mean in the context of your overall health.
Do not change prescription medication doses based only on information from a generic sugar level chart. Treatment decisions should be made with your healthcare team.
If you have diabetes and experience severe symptoms or a situation covered by your personal diabetes emergency plan, follow that plan and seek appropriate medical care.
Frequently Asked Questions About Sugar Level Charts
What is a normal sugar level?
For diagnostic fasting blood glucose, the CDC considers 99 mg/dL or below to be within the normal range. The interpretation of a glucose result depends on the specific test and circumstances.
What sugar level is considered prediabetes?
For fasting blood glucose, 100–125 mg/dL is within the prediabetes range. An A1C result of 5.7%–6.4% is also within the prediabetes range.
What sugar level is considered diabetes?
For diagnostic testing, a fasting blood glucose result of 126 mg/dL or above or an A1C result of 6.5% or above is within the diabetes range. Healthcare professionals may use additional testing and clinical evaluation when confirming a diagnosis.
What is a common blood sugar target after eating?
For most nonpregnant adults with diabetes, the ADA recommends a common target of less than 180 mg/dL one to two hours after the beginning of a meal. Individual targets can differ.
Does a sugar level chart diagnose diabetes?
No. A general chart provides reference information, but it cannot replace diagnostic testing or professional evaluation. If you have concerning or repeatedly abnormal results, discuss them with a healthcare professional.
Conclusion
A sugar level chart is a practical tool for understanding common blood glucose ranges and organizing personal readings. It can help you distinguish between diagnostic reference ranges, diabetes monitoring targets, and your own day-to-day results.
The most important point is that blood sugar targets are not identical for everyone. Use a printable chart to keep organized records, watch for meaningful patterns, and communicate useful information with your healthcare team. When your results are concerning or unclear, professional guidance is more reliable than interpreting a generic chart on your own.
