A blood sugar chart is a useful reference for understanding glucose readings and tracking changes over time. Whether you are monitoring your blood sugar at home, learning about prediabetes, or managing diabetes, a clear chart can make your results easier to record and review.
Blood sugar can change throughout the day depending on meals, physical activity, stress, illness, medications, and other factors. For that reason, a single reading does not always tell the whole story. Keeping a regular blood sugar log can help you and your healthcare provider identify patterns and understand how your glucose levels respond to different situations.
What Is a Blood Sugar Chart?
A blood sugar chart is a reference tool that organizes blood glucose levels according to the type of test and the timing of the measurement. It may include fasting blood sugar, blood sugar after eating, A1C results, and personal target ranges.
Some blood sugar charts are designed for general educational reference, while others are printable tracking sheets. A printable blood sugar chart can provide space to record readings by date and time, along with notes about meals, exercise, medication, or other factors that may affect glucose levels.
It is important to understand that reference ranges used for diagnosis are not necessarily the same as individualized treatment targets. Your healthcare provider may recommend different goals based on your health history and treatment plan.
Blood Sugar Chart Reference Ranges
The following values are commonly used for identifying normal blood sugar, prediabetes, and diabetes during specific diagnostic tests. They should be viewed as reference information rather than a personal diagnosis.
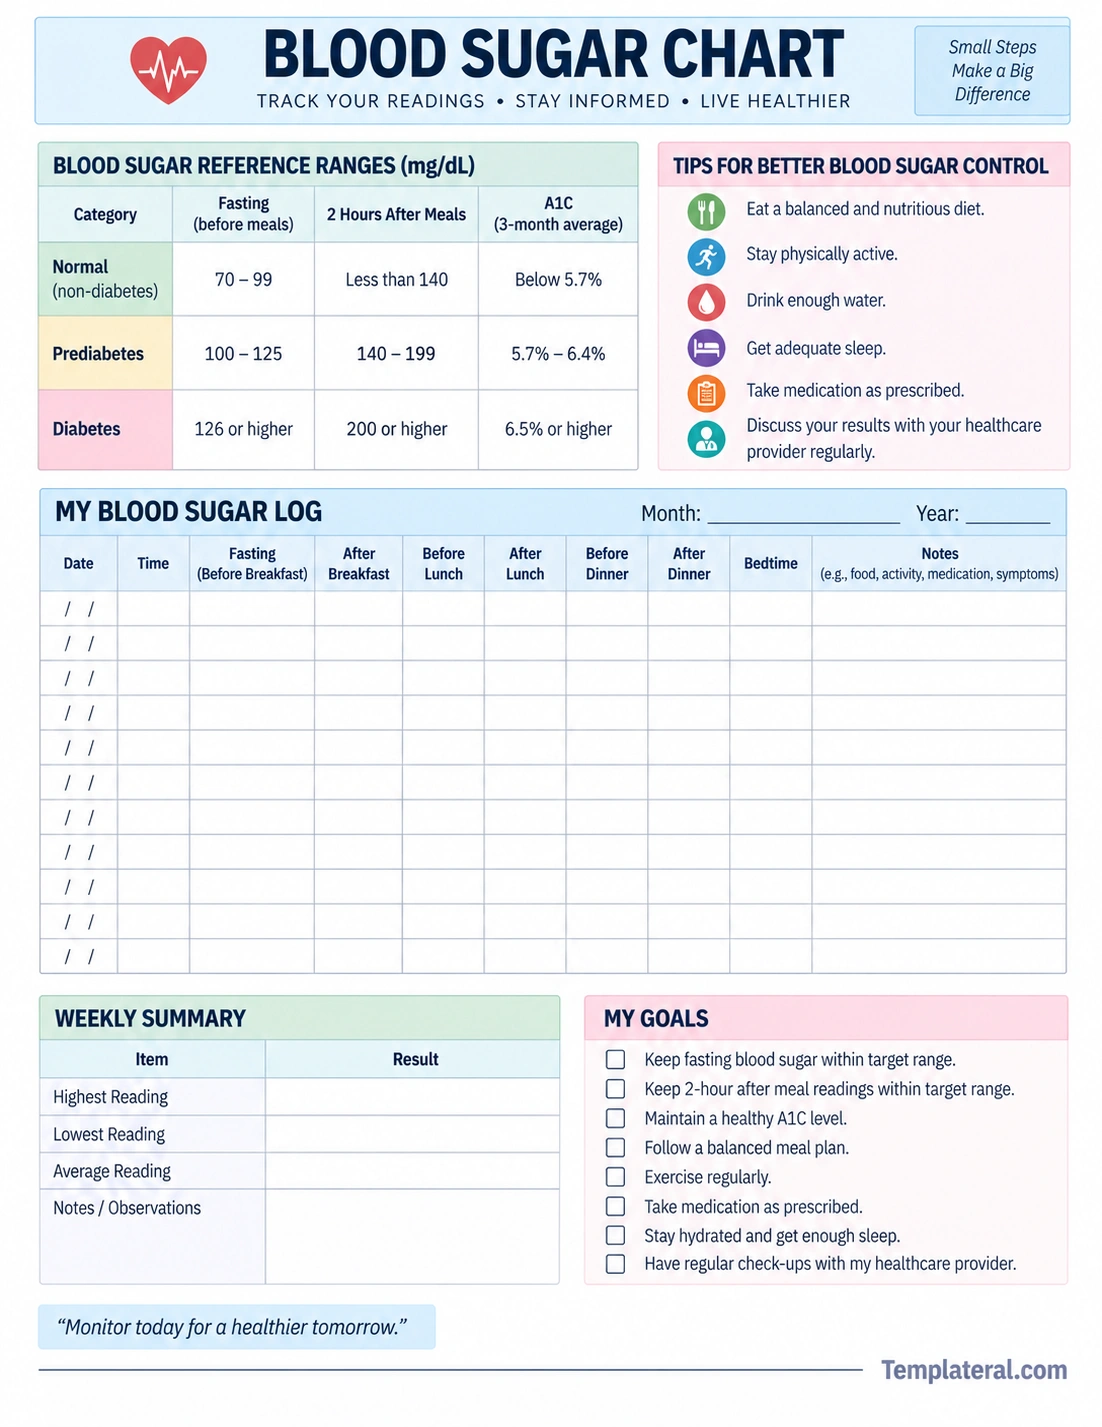
- Fasting blood glucose: Normal is 99 mg/dL or below, prediabetes is 100 to 125 mg/dL, and diabetes is 126 mg/dL or above.
- A1C: Normal is below 5.7%, prediabetes is 5.7% to 6.4%, and diabetes is 6.5% or above.
- Two-hour oral glucose tolerance test: Normal is below 140 mg/dL, prediabetes is 140 to 199 mg/dL, and diabetes is 200 mg/dL or above.
These diagnostic ranges are used by healthcare professionals to evaluate blood glucose status. A diagnosis should not be made from a single home blood glucose reading or a general chart. Healthcare professionals may use repeat testing and clinical context when interpreting results.
Blood Sugar Levels Before and After Meals
The timing of a blood glucose reading matters. A fasting reading is taken after not eating for an overnight period, while a post-meal reading shows how glucose changes after eating.
Fasting Blood Sugar
Fasting blood sugar is commonly measured in the morning before eating. It can provide useful information about glucose regulation when the body has not recently received food.
For diagnostic testing, a fasting glucose level of 100 to 125 mg/dL falls within the prediabetes range, while 126 mg/dL or higher is within the diabetes range. However, a home meter reading should not be used by itself to diagnose diabetes.
Blood Sugar After Eating
Blood glucose normally changes after a meal because carbohydrates are broken down into glucose. The amount and timing of the increase can vary depending on the meal, physical activity, insulin response, medications, and individual health factors.
For most nonpregnant adults with diabetes, the American Diabetes Association lists a common target of 80 to 130 mg/dL before meals and less than 180 mg/dL one to two hours after the beginning of a meal. Individual targets may be more or less strict depending on the person’s circumstances.
Understanding A1C in a Blood Sugar Chart
A1C is different from a typical blood glucose meter reading. Instead of showing the glucose level at one specific moment, an A1C test provides an estimate of average blood sugar exposure over approximately the previous two to three months.
According to the CDC, an A1C below 5.7% is considered normal, 5.7% to 6.4% is within the prediabetes range, and 6.5% or above is within the diabetes range for diagnostic purposes.
For people who already have diabetes, A1C goals are individualized. The ADA notes that an A1C target of less than 7% is appropriate for many nonpregnant adults, but personal goals can vary based on factors such as age, health conditions, duration of diabetes, and risk of hypoglycemia.
Printable Blood Sugar Chart Template
A printable blood sugar chart can make daily tracking easier. Instead of trying to remember previous readings, you can write them down as they occur and review the information later.
The blood sugar chart template included with this article provides areas for recording fasting readings, readings around meals, bedtime readings, notes, weekly results, and personal goals.
What Should You Record on a Blood Sugar Chart?
A useful blood sugar log should contain enough information to help you recognize patterns. You do not necessarily need to record every possible detail. Focus on information that your healthcare provider has asked you to monitor.
- Date: Record the day of each reading.
- Time: Note when the measurement was taken.
- Blood glucose: Write down the glucose reading and measurement unit.
- Meal timing: Indicate whether the reading was before or after a meal.
- Food: Add brief notes about meals when relevant.
- Physical activity: Record exercise or unusual activity that may affect your reading.
- Medication: Record medications only as directed by your healthcare professional.
- Symptoms: Note unusual symptoms that occur around a reading.
- Additional notes: Include relevant factors such as illness, stress, travel, or changes in routine.
How to Use a Blood Sugar Chart Effectively
1. Follow Your Recommended Testing Schedule
There is no single testing schedule that works for everyone. Some people may need to check at particular times of day, while others may use continuous glucose monitoring or less frequent testing. Follow the schedule recommended by your healthcare team.
2. Record Readings Consistently
Try to record readings soon after checking them. Consistent records are easier to review than information entered from memory several hours later.
3. Record Important Context
A glucose number can be more useful when you know what was happening around the measurement. For example, a note about a large meal or an unusually active day can provide helpful context when reviewing patterns.
4. Look for Patterns Instead of One Number
One unusual reading does not necessarily explain what is happening with your blood sugar. Look at repeated readings and discuss recurring patterns with your healthcare provider.
Factors That Can Affect Blood Sugar Readings
Blood glucose is influenced by many factors. A reading may change even when your normal routine seems similar from one day to the next.
- Food and carbohydrate intake
- Physical activity and exercise
- Stress
- Illness or infection
- Sleep and changes in routine
- Medications
- Alcohol consumption
- Hormonal changes
- Timing of meals and medication
Because many factors can affect glucose, your chart becomes more useful when it includes brief notes about meaningful changes in your routine.
Blood Sugar Chart for People With Diabetes
For people living with diabetes, a blood sugar chart can be part of a larger diabetes management plan. The ADA states that glucose targets are individualized. For many nonpregnant adults with diabetes, commonly recommended targets include 80 to 130 mg/dL before meals and less than 180 mg/dL one to two hours after the start of a meal.
These numbers are general targets rather than universal rules. Your healthcare provider may set different targets based on your age, health conditions, treatment, risk of low blood glucose, and other individual considerations.
Blood Sugar Chart for Prediabetes
Prediabetes means that blood glucose levels are higher than the normal range but do not meet the diagnostic threshold for diabetes. According to the CDC, common diagnostic ranges include fasting blood glucose of 100 to 125 mg/dL or an A1C of 5.7% to 6.4%.
If you receive a result in the prediabetes range, discuss it with a healthcare professional. They can help determine whether additional testing is appropriate and recommend steps based on your individual situation.
Why Tracking Blood Sugar Can Be Helpful
Regular tracking can help create a clearer picture of how blood glucose changes throughout the day. It can also provide useful information to share during healthcare appointments.
For example, a person may notice that readings tend to change after certain meals, during periods of reduced activity, or when their routine changes. A healthcare professional can help determine whether those patterns are meaningful and whether any part of the management plan needs attention.
Blood Sugar Chart vs. Blood Sugar Log
The terms blood sugar chart and blood sugar log are sometimes used interchangeably, but they can describe slightly different tools.
- Blood sugar chart: Often provides reference ranges or organized information about glucose levels.
- Blood sugar log: Usually focuses on recording personal readings over time.
- Printable blood sugar chart: Can combine reference information with spaces for personal tracking.
- Blood glucose worksheet: May include additional sections for goals, meals, exercise, symptoms, or notes.
A combined chart and log can be especially convenient because reference information and personal readings are available in one place.
When to Discuss Blood Sugar Results With a Healthcare Provider
Talk with your healthcare provider if you repeatedly notice readings outside the target range provided for you, significant changes in your usual pattern, or results that concern you.
Do not change prescription medication doses based only on a generic blood sugar chart. Medication and treatment decisions should be made with your healthcare team.
If you have diabetes and experience severe symptoms or a situation that your healthcare team has identified as an emergency, follow your diabetes care plan and seek appropriate medical care.
Tips for Keeping a Useful Blood Sugar Record
- Keep your chart in a location that is easy to access.
- Use the same measurement units consistently.
- Record readings as soon as practical.
- Include meal or activity notes when they are relevant.
- Bring your records to healthcare appointments when requested.
- Use your personal glucose targets rather than assuming a generic chart applies to you.
- Review recurring patterns with your healthcare provider instead of reacting to one isolated result.
Frequently Asked Questions About Blood Sugar Charts
What is a normal blood sugar level?
For diagnostic fasting blood glucose, the CDC lists 99 mg/dL or below as normal. However, the meaning of a blood glucose reading depends on the test, timing, and individual circumstances.
What blood sugar level is considered prediabetes?
For fasting blood glucose, 100 to 125 mg/dL is within the prediabetes range used for diagnosis. An A1C result of 5.7% to 6.4% is also within the CDC’s prediabetes range.
What blood sugar level is considered diabetes?
For diagnostic testing, the CDC lists fasting blood glucose of 126 mg/dL or above and A1C of 6.5% or above as diabetes-range results. Additional testing and clinical evaluation may be used to confirm a diagnosis.
What is a good blood sugar level after eating?
For many nonpregnant adults with diabetes, the ADA recommends a common target of less than 180 mg/dL one to two hours after the beginning of a meal. Personal targets can differ, so follow the range provided by your healthcare team.
Conclusion
A blood sugar chart can be a simple and practical tool for organizing glucose information. It can help you record readings, understand common reference ranges, and recognize patterns that may be worth discussing with a healthcare professional.
Remember that general blood sugar ranges are not a substitute for personalized medical advice. Diagnostic values, diabetes treatment targets, and monitoring schedules can vary depending on the individual. Use a printable chart as a tracking and organization tool, and discuss your results with your healthcare team when you have questions or concerns.
