A blood glucose chart is a useful reference for recording and understanding blood sugar readings at different times of the day. It can help organize measurements taken before meals, after meals, at bedtime, or at other times recommended by a healthcare professional. Keeping a consistent record can make it easier to notice patterns and discuss them with a doctor or diabetes care team.
Blood glucose targets are not identical for everyone. They can vary depending on factors such as age, health conditions, pregnancy status, diabetes treatment, and an individual’s care plan. For that reason, a chart should be used as a tracking and reference tool rather than as a substitute for personalized medical advice.
What Is a Blood Glucose Chart?
A blood glucose chart is a table or worksheet used to record blood sugar measurements. A typical chart may include the date, time, glucose reading, relationship to meals, medication information, physical activity, and additional notes.
Blood glucose is measured using different methods. A home glucose meter provides a reading at a particular moment, while an A1C test provides information about average blood glucose over roughly the previous two to three months. These measurements serve different purposes and should not be treated as interchangeable.
A well-organized blood glucose chart can help you see how readings change throughout the day and identify recurring patterns that may be worth discussing with a healthcare professional.
Why Use a Blood Glucose Chart?
Recording blood sugar readings can provide useful information about how glucose levels change in relation to meals, physical activity, medication, stress, illness, and other factors.
- Track daily readings: Record glucose measurements in one convenient location.
- Identify patterns: Look for repeated highs or lows at similar times.
- Prepare for appointments: Bring an organized record when discussing glucose management with your healthcare team.
- Record related factors: Add notes about meals, activity, medication, illness, or other relevant circumstances.
- Monitor progress: Compare readings over time as part of an individualized diabetes management plan.
The American Diabetes Association notes that blood glucose targets should be individualized. For many nonpregnant adults with diabetes, commonly used targets are 80–130 mg/dL before a meal and less than 180 mg/dL one to two hours after the beginning of a meal, but an individual’s healthcare professional may recommend different targets.
Blood Glucose Chart for Common Testing Times
The time at which glucose is measured can affect how a reading should be interpreted. A chart can therefore include separate spaces for different testing situations.
Fasting or Before-Meal Reading
A fasting glucose measurement is generally taken after not eating overnight. In everyday diabetes monitoring, a before-meal reading may also be recorded immediately before eating.
These measurements should not automatically be interpreted using the same criteria. Diagnostic fasting plasma glucose testing and day-to-day diabetes monitoring have different purposes and reference ranges.
After-Meal Reading
Some people with diabetes are instructed to check glucose after eating. The American Diabetes Association commonly refers to a post-meal target of less than 180 mg/dL for many nonpregnant adults with diabetes, measured one to two hours after the beginning of a meal.
The exact timing and target should follow the instructions provided by the person’s healthcare professional.
Bedtime Reading
Some diabetes management plans include a bedtime glucose check. Whether this measurement is necessary depends on the individual’s treatment plan and health circumstances.
A blood glucose chart can provide a dedicated column for bedtime readings when they are part of the person’s monitoring routine.
Blood Glucose Chart and A1C Results
A1C is different from a single blood glucose reading. It estimates average blood glucose over approximately the previous two to three months and is commonly used to diagnose prediabetes and diabetes and to monitor diabetes management.
For diagnostic purposes, the CDC lists the following A1C categories:
- Normal: below 5.7%
- Prediabetes: 5.7% to 6.4%
- Diabetes: 6.5% or above
These are diagnostic categories, not individualized daily blood glucose targets. A healthcare professional may also consider symptoms, other laboratory results, medications, and overall health when interpreting test results.
Blood Glucose Chart Template
A printable blood glucose chart template can make daily tracking more convenient. Instead of keeping readings in scattered notes, you can record them in a structured table and add observations that may provide useful context.
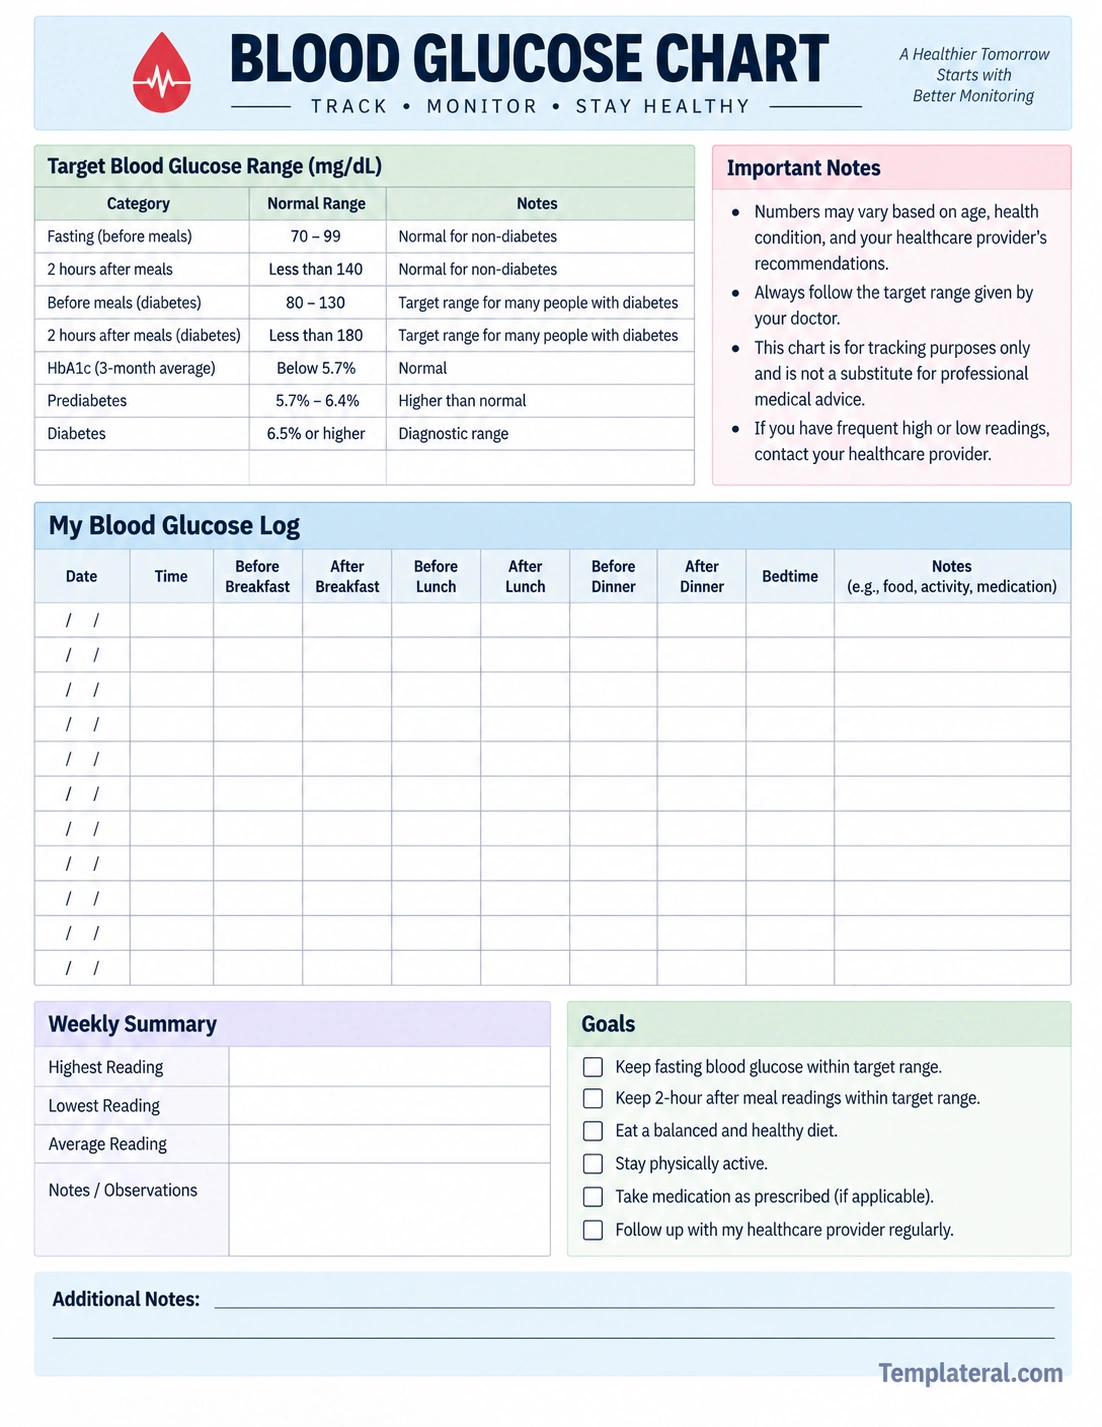
A useful chart can include spaces for readings before and after breakfast, lunch, and dinner, as well as bedtime. It can also provide room for notes about food, activity, medication, or other circumstances.
What Information Should You Record?
The amount of information you need to record depends on your monitoring plan. A simple chart may contain only the date, time, and glucose reading, while a more detailed log can include additional information.
- Date: Record the day of the measurement.
- Time: Note when the glucose test was taken.
- Glucose reading: Enter the measurement shown by your meter or monitoring system.
- Meal timing: Indicate whether the reading was before or after a meal when relevant.
- Medication: Record medication information if your healthcare professional has asked you to track it.
- Food: Add relevant meal or carbohydrate information when appropriate.
- Physical activity: Note exercise or unusual activity that may affect your reading.
- Notes: Record illness, stress, symptoms, or other relevant observations.
How to Use a Blood Glucose Chart Effectively
A chart becomes more useful when measurements are recorded consistently. Follow the monitoring schedule provided by your healthcare professional rather than testing more frequently simply because a chart has additional spaces.
Record Readings Promptly
Enter the reading soon after checking your blood glucose. Recording it immediately reduces the chance of forgetting the number or confusing it with another measurement.
Include Useful Context
A number by itself may not explain why glucose changed. Notes about meals, physical activity, medication, stress, or illness can provide additional context when reviewing a series of readings.
Look for Repeated Patterns
One unusual reading does not necessarily explain what is happening overall. Instead, look for repeated patterns at similar times or under similar circumstances.
For example, several readings that are consistently outside your personal target range may be worth discussing with your healthcare professional.
Understanding Blood Glucose Numbers
Blood glucose values can be presented in different units. In the United States, glucose is commonly reported in mg/dL, while many other countries use mmol/L.
For people who need to convert between the two systems, a commonly used approximation is:
mg/dL ÷ 18 = mmol/L
and:
mmol/L × 18 = mg/dL
For example, 90 mg/dL is approximately 5.0 mmol/L. When recording results, make sure you know which unit your meter or laboratory uses.
Diagnostic Blood Glucose Ranges
Diagnostic testing is different from routine home glucose monitoring. According to the CDC, a fasting plasma glucose result of less than 100 mg/dL is in the normal range, 100–125 mg/dL is in the prediabetes range, and 126 mg/dL or above is in the diabetes range.
These values apply to a specific diagnostic test performed under appropriate conditions. A single home meter reading should not be used by itself to diagnose diabetes.
Fasting Plasma Glucose
- Normal: below 100 mg/dL
- Prediabetes: 100–125 mg/dL
- Diabetes: 126 mg/dL or above
Healthcare professionals may use additional testing to confirm a diagnosis when appropriate.
Two-Hour Oral Glucose Tolerance Test
Another diagnostic test is the oral glucose tolerance test. For the standard test used to diagnose diabetes and prediabetes, the glucose measurement is taken two hours after drinking a glucose-containing solution.
- Normal: below 140 mg/dL
- Prediabetes: 140–199 mg/dL
- Diabetes: 200 mg/dL or above
This diagnostic test should not be confused with a routine two-hour post-meal home glucose measurement.
Blood Glucose Chart for People With Diabetes
For many nonpregnant adults with diabetes, the American Diabetes Association lists a general target of 80–130 mg/dL before meals and less than 180 mg/dL one to two hours after the beginning of a meal.
However, these numbers are not universal personal goals. The appropriate target can depend on age, duration of diabetes, other health conditions, cardiovascular disease, complications, hypoglycemia awareness, and other individual considerations.
For this reason, the most useful blood glucose chart is one that allows you to record the personal targets provided by your healthcare professional.
Factors That Can Affect Blood Glucose Readings
Blood glucose can change for many reasons. A chart can be especially helpful when you record relevant circumstances alongside the measurement.
- Food and carbohydrate intake
- Physical activity
- Diabetes medication
- Stress
- Illness
- Changes in sleep
- Changes in routine
- Hormonal changes
Recording these factors does not prove that a particular factor caused a specific reading. Instead, the information can help you and your healthcare team identify patterns that may require further discussion.
Tips for Keeping an Accurate Blood Glucose Log
- Use the same units consistently: Make sure you know whether readings are in mg/dL or mmol/L.
- Follow your monitoring schedule: Test at the times recommended for your individual care plan.
- Record readings accurately: Avoid relying on memory later in the day.
- Add relevant notes: Include information that could help explain changes.
- Review trends: Look for recurring patterns instead of focusing on one number.
- Bring the chart to appointments: Your healthcare team can use the information when reviewing your diabetes management plan.
When to Discuss Blood Glucose Results With a Healthcare Professional
If your readings are repeatedly outside the target range provided for you, discuss them with your healthcare professional. They can help determine whether changes to your monitoring routine or treatment plan are appropriate.
Do not change prescription medication doses based solely on a generic blood glucose chart. Diabetes treatment should be individualized and adjusted according to your healthcare professional’s instructions.
If you experience symptoms of very high or very low blood glucose, follow the action plan provided by your healthcare team. If symptoms are severe, unusual, or potentially life-threatening, seek urgent medical care.
Blood Glucose Chart vs. Blood Sugar Log
The terms blood glucose chart and blood sugar log are often used interchangeably. Both can describe a tool for recording glucose measurements over time.
A chart may focus more on visual reference ranges and structured tables, while a log may emphasize daily entries. In practice, either format can be useful as long as it captures the information required by the individual’s monitoring plan.
Conclusion
A blood glucose chart is a practical way to organize blood sugar readings and observe patterns over time. It can include measurements taken before or after meals, bedtime readings, notes about food and activity, and other information relevant to an individual’s diabetes management plan.
It is important to distinguish general reference ranges from personal treatment targets and from diagnostic test thresholds. Blood glucose goals are individualized, while tests such as fasting plasma glucose, oral glucose tolerance testing, and A1C are interpreted according to specific clinical criteria.
A printable blood glucose chart can make recordkeeping easier and provide a clear format for discussing readings with a healthcare professional. Use the chart as a tracking tool, follow your individualized monitoring instructions, and consult your healthcare team when you have questions about what your results mean.
